Building Customer Cohorts: Understanding Retention Beyond a Single Metric

A single overall retention rate tells you almost nothing about why customers are actually staying or leaving. Two stores can report the exact same 30 percent retention rate while having completely different underlying stories, one improving steadily, the other masking a serious churn problem behind a strong new-customer influx. Cohort analysis is what separates a real diagnosis from a misleading headline number.
Why a Single Retention Number Hides the Real Story
Overall retention rate averages together every customer regardless of when they joined, which means a declining trend among new customers can be completely obscured by strong loyalty among longtime buyers, or vice versa. A store might see steady total revenue while its most recent acquisition cohorts are actually retaining worse than ever, a problem invisible until you break the data apart by cohort.
What a Customer Cohort Actually Is
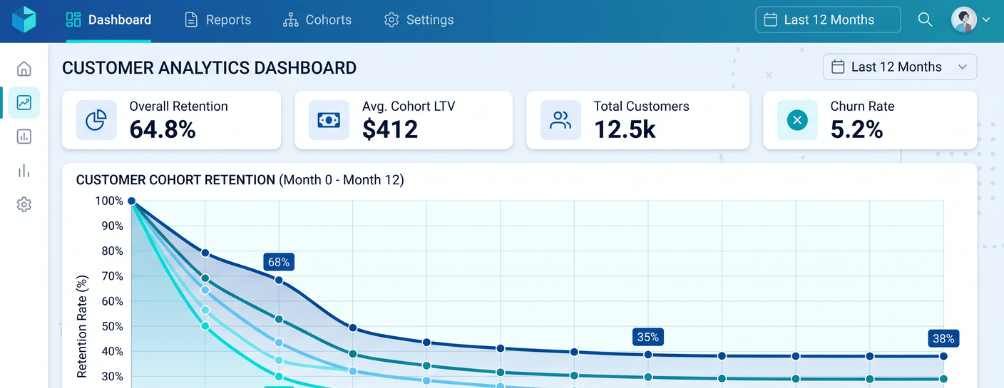
A cohort is simply a group of customers who share a starting point, most commonly the month of their first purchase, though cohorts can also be built around acquisition channel, first product purchased, or onboarding flow. Tracking how each cohort’s retention curve behaves over subsequent months reveals patterns that a single blended metric cannot show.
Common Ways to Build Cohorts
| Cohort Type | Grouped By | What It Reveals |
| Acquisition-date cohort | Month of first purchase | Whether retention is improving or declining over time |
| Channel cohort | Marketing channel or source | Which acquisition channels bring the most loyal customers |
| Product cohort | First product purchased | Which products predict long-term retention |
See cohort dashboards in action
Reading a Retention Curve Correctly
Most cohorts show a natural drop-off after the first month, followed by a flattening curve as the remaining customers settle into a steadier repeat-purchase pattern. What matters most is comparing this curve across different cohorts, if customers acquired in more recent months are dropping off faster than older cohorts did at the same point in their lifecycle, that is an early warning sign worth investigating before it shows up in overall revenue numbers.
Turning Cohort Data Into Action
- Compare retention curves by acquisition channel to identify which channels bring genuinely loyal customers, not just cheap first orders
- Segment by first product purchased to find which SKUs act as strong entry points into repeat buying behavior
- Track cohort revenue, not just retention percentage, since a smaller but higher-spending cohort can outperform a larger low-value one
Setting This Up Without a Data Team
Cohort analysis sounds like it requires a dedicated analytics setup, but most modern commerce platforms can group customers by first purchase date and track repeat behavior directly from existing order data, without needing a separate business intelligence tool bolted on. According to a practical guide on cohort retention analysis for ecommerce, the key starting point is simply committing to review cohort data on a regular cadence rather than only during quarterly deep dives, since early warning signs in a fresh cohort’s retention curve are far more actionable when caught within the first few months.
Zyfoo merchants can access cohort-based reporting directly through their commerce platform’s CRM module rather than exporting order data to a separate analytics tool, which keeps the retention picture tied directly to real order history.